Teaching
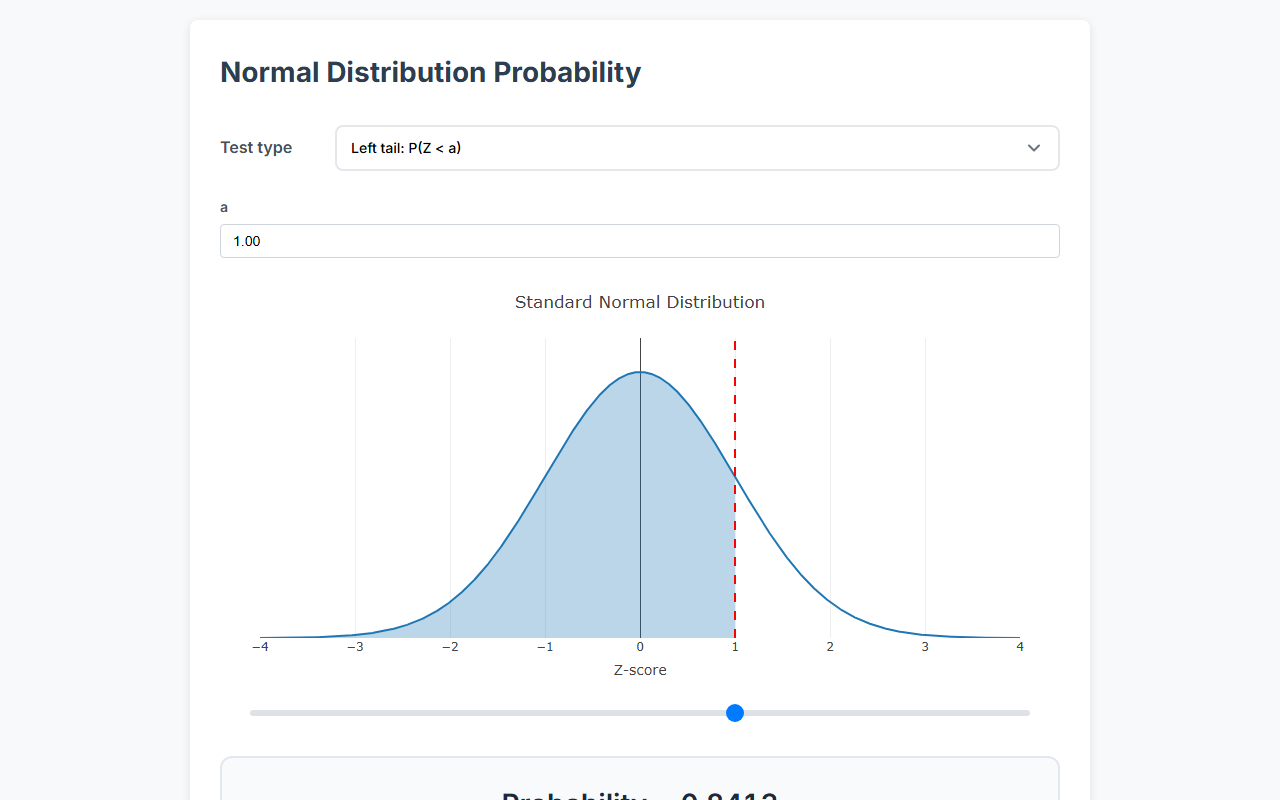
Interactive Normal Distribution
A probability calculator for the standard normal distribution. Students choose a one- or two-tailed test, slide a Z-score, and watch the shaded area and probability update in real time. Used in introductory statistics lectures.
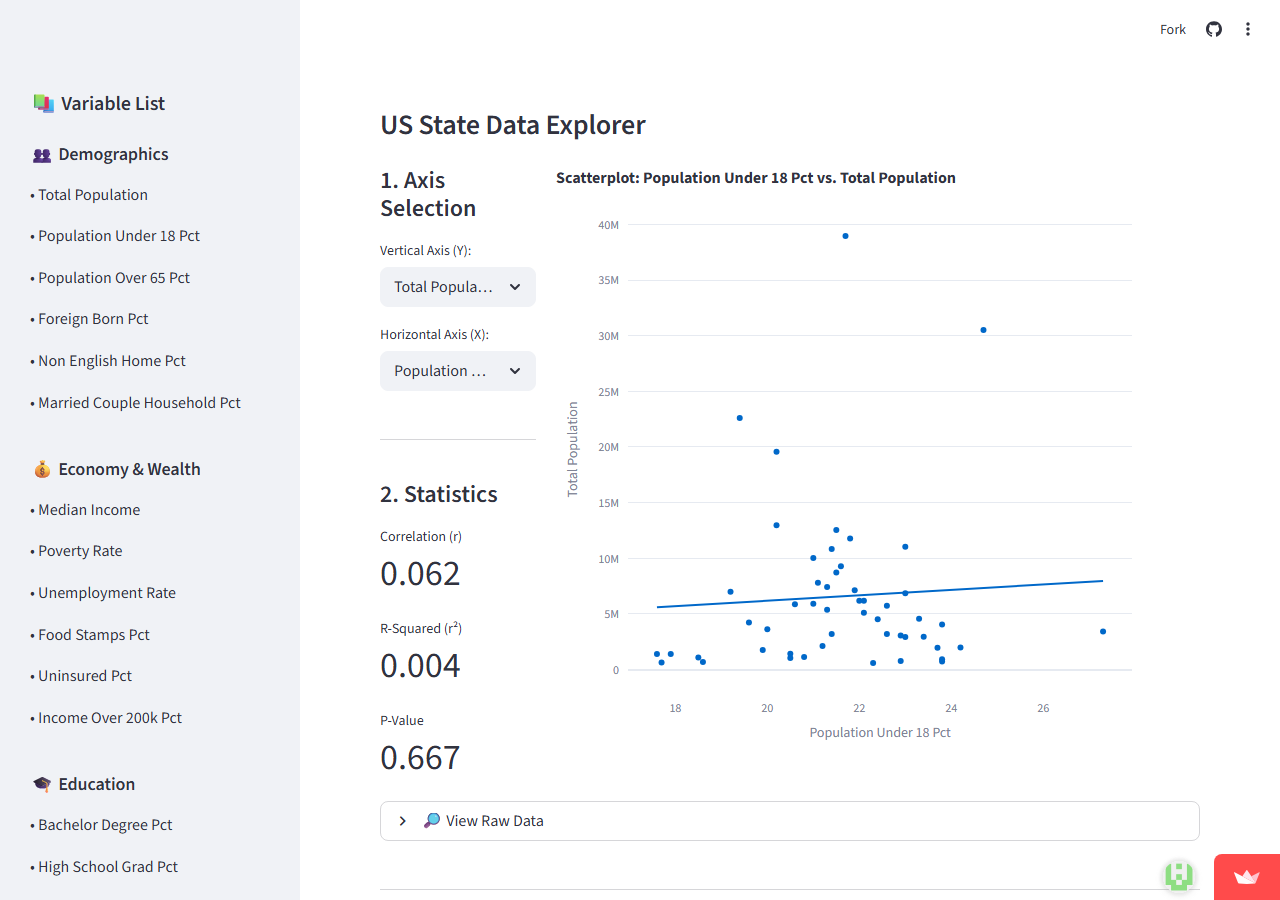
Correlation Generator
A Streamlit app that lets students pick two variables from U.S. state-level demographic, economic, and education data and see the resulting scatterplot, correlation coefficient, R², and p-value. Helps students build intuition for what different values of r look like in real data.
Research
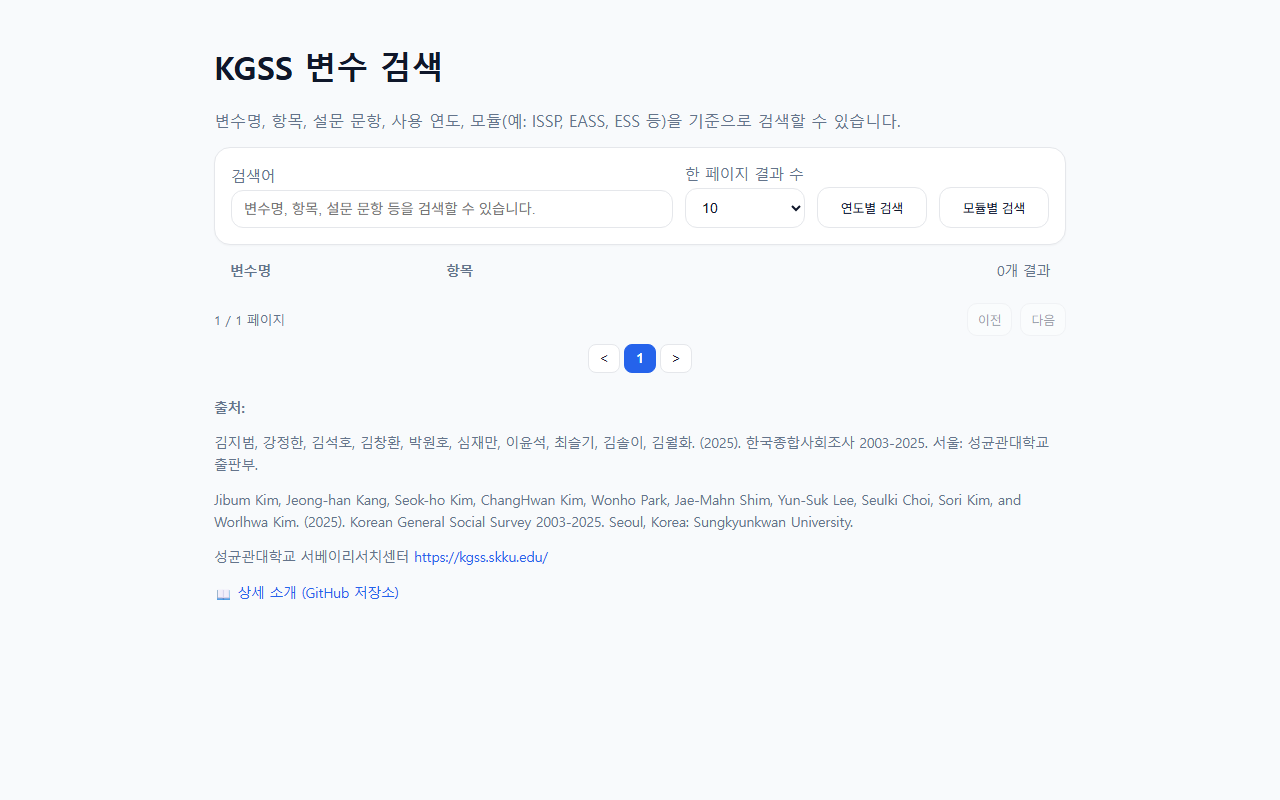
KGSS Variable Finder
A search tool for variables in the Korean General Social Survey (KGSS). Users can search by variable name, item, question text, survey year, or module (ISSP, EASS, ESS). Korean-language interface.